Analytics
Numbers thatbuild business
Every order is data. Every expense is information. See full financial picture of your restaurant in real-time.
- Charts
- PDF Reports
- Excel Export
- Data Saved
- 100%
- To PDF Report
- 1 click
- Order History
- ∞
- Updates
- Real-time
Dashboard
Everything in one view
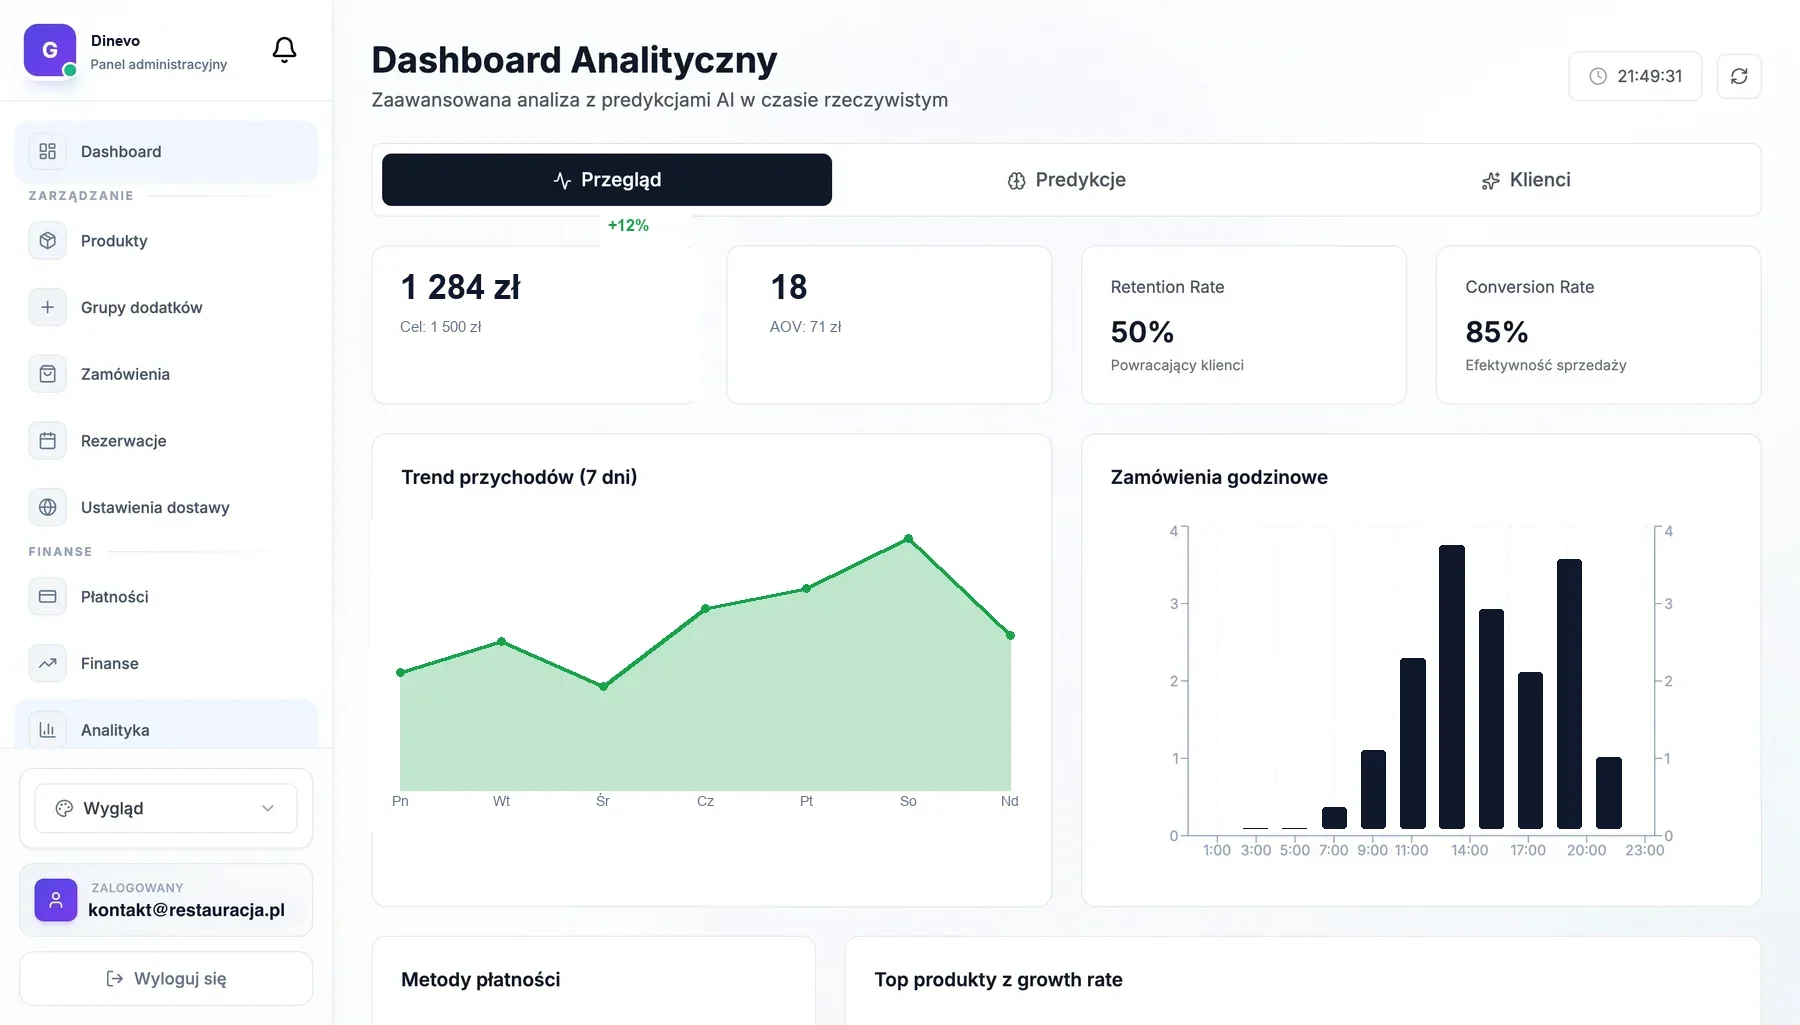
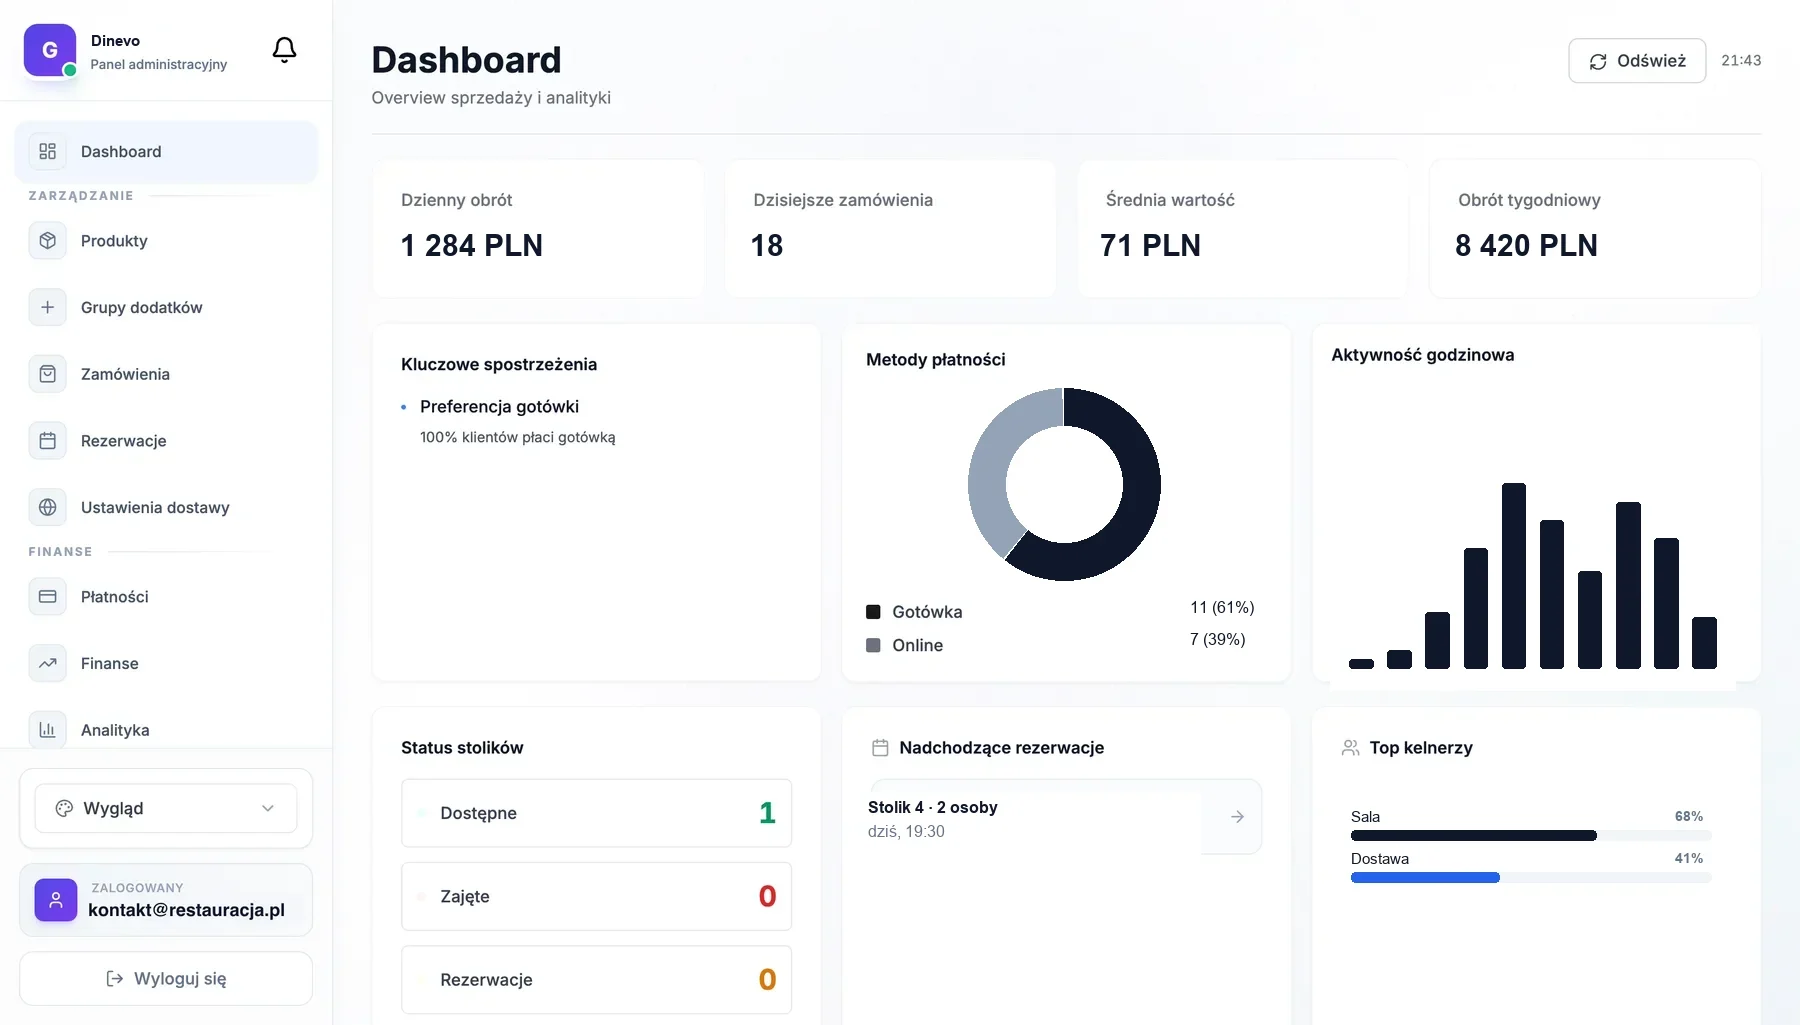
Open panel and instantly see: today's revenue, trends, bestsellers. No clicking, no searching.
Charts
Visualizeyour success
Every order automatically goes to charts. See daily, weekly, monthly trends. Compare periods and plan ahead.
- Sales chart over time
- Week day comparison
- Peak hour analysis
- Growth/decline trend
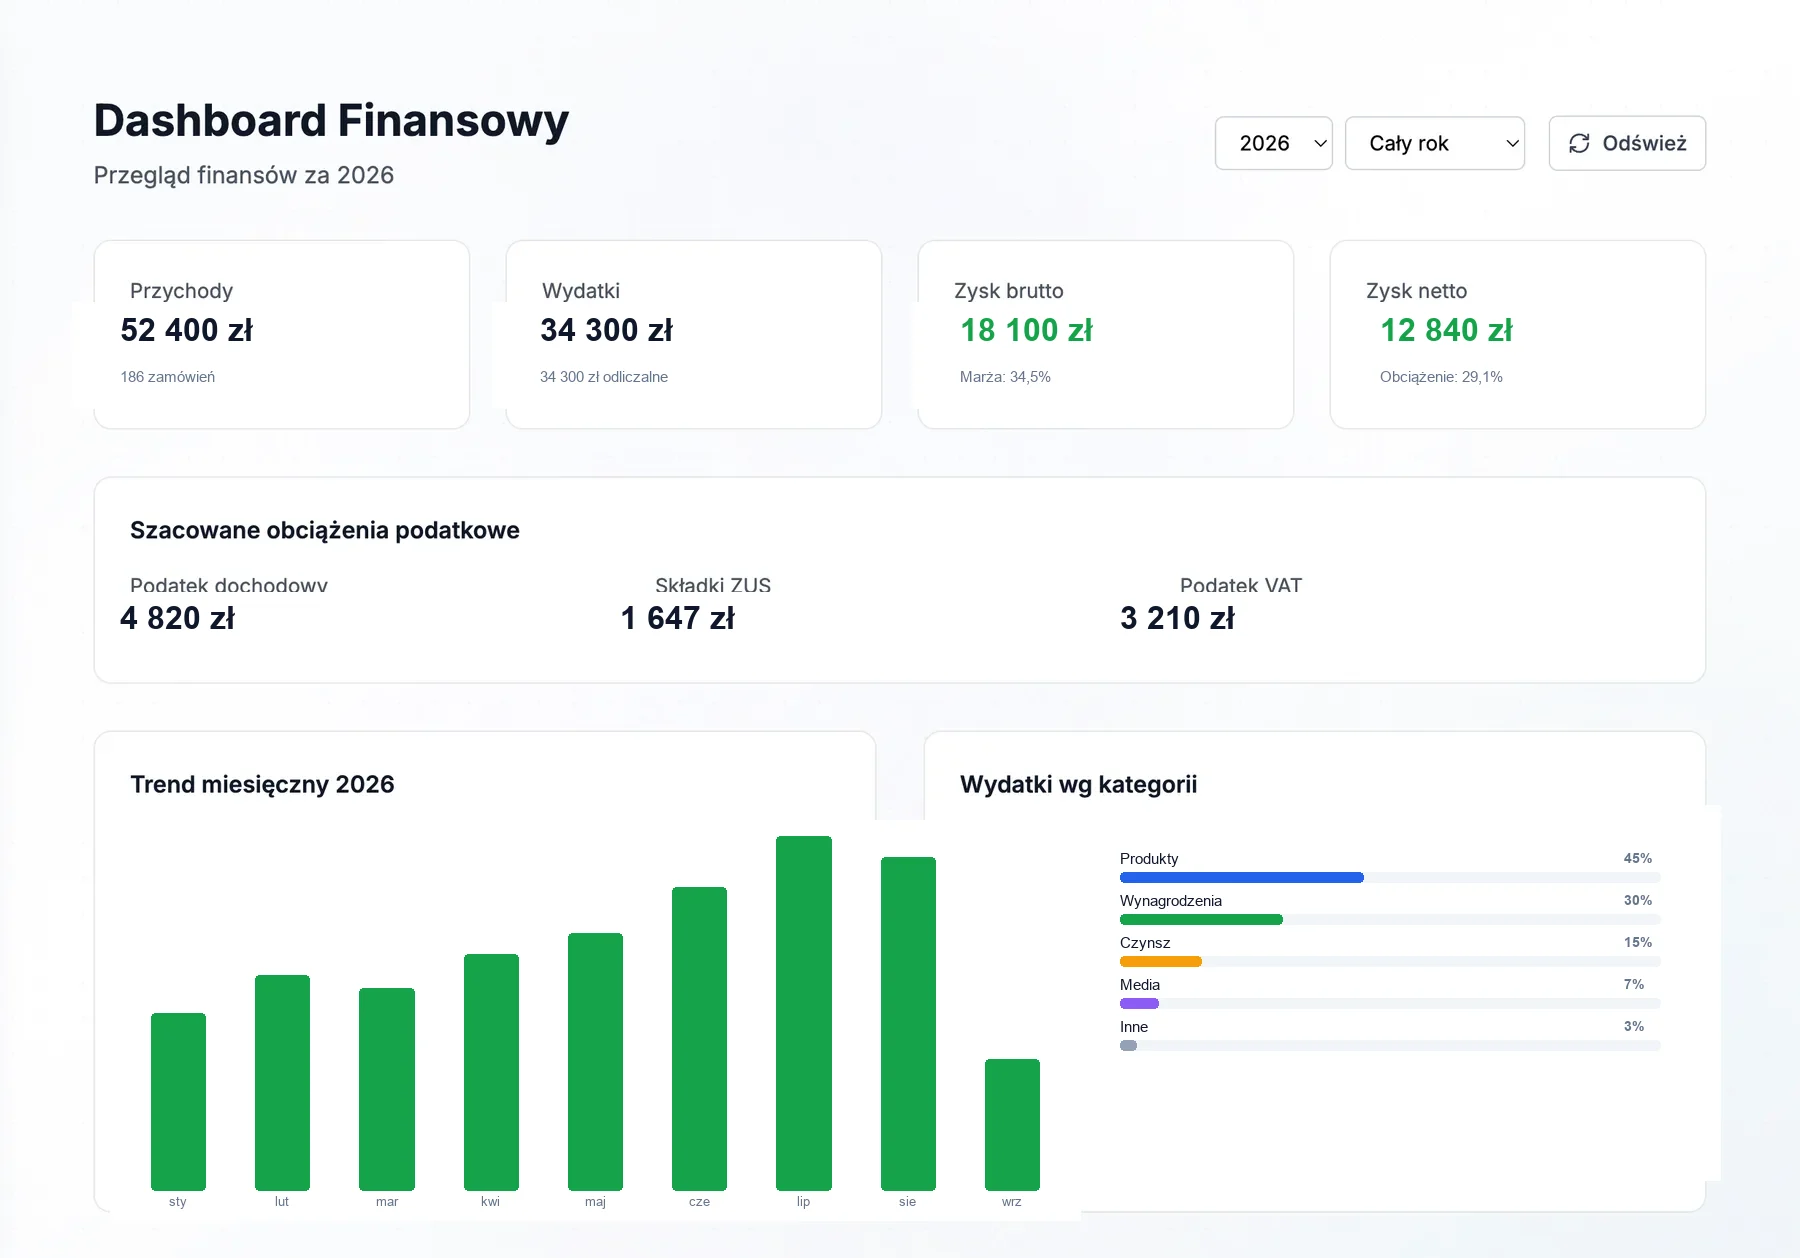
Cost Structure
- Products45%
- Salaries30%
- Rent15%
- Utilities7%
- Other3%
Expenses
Controlevery penny
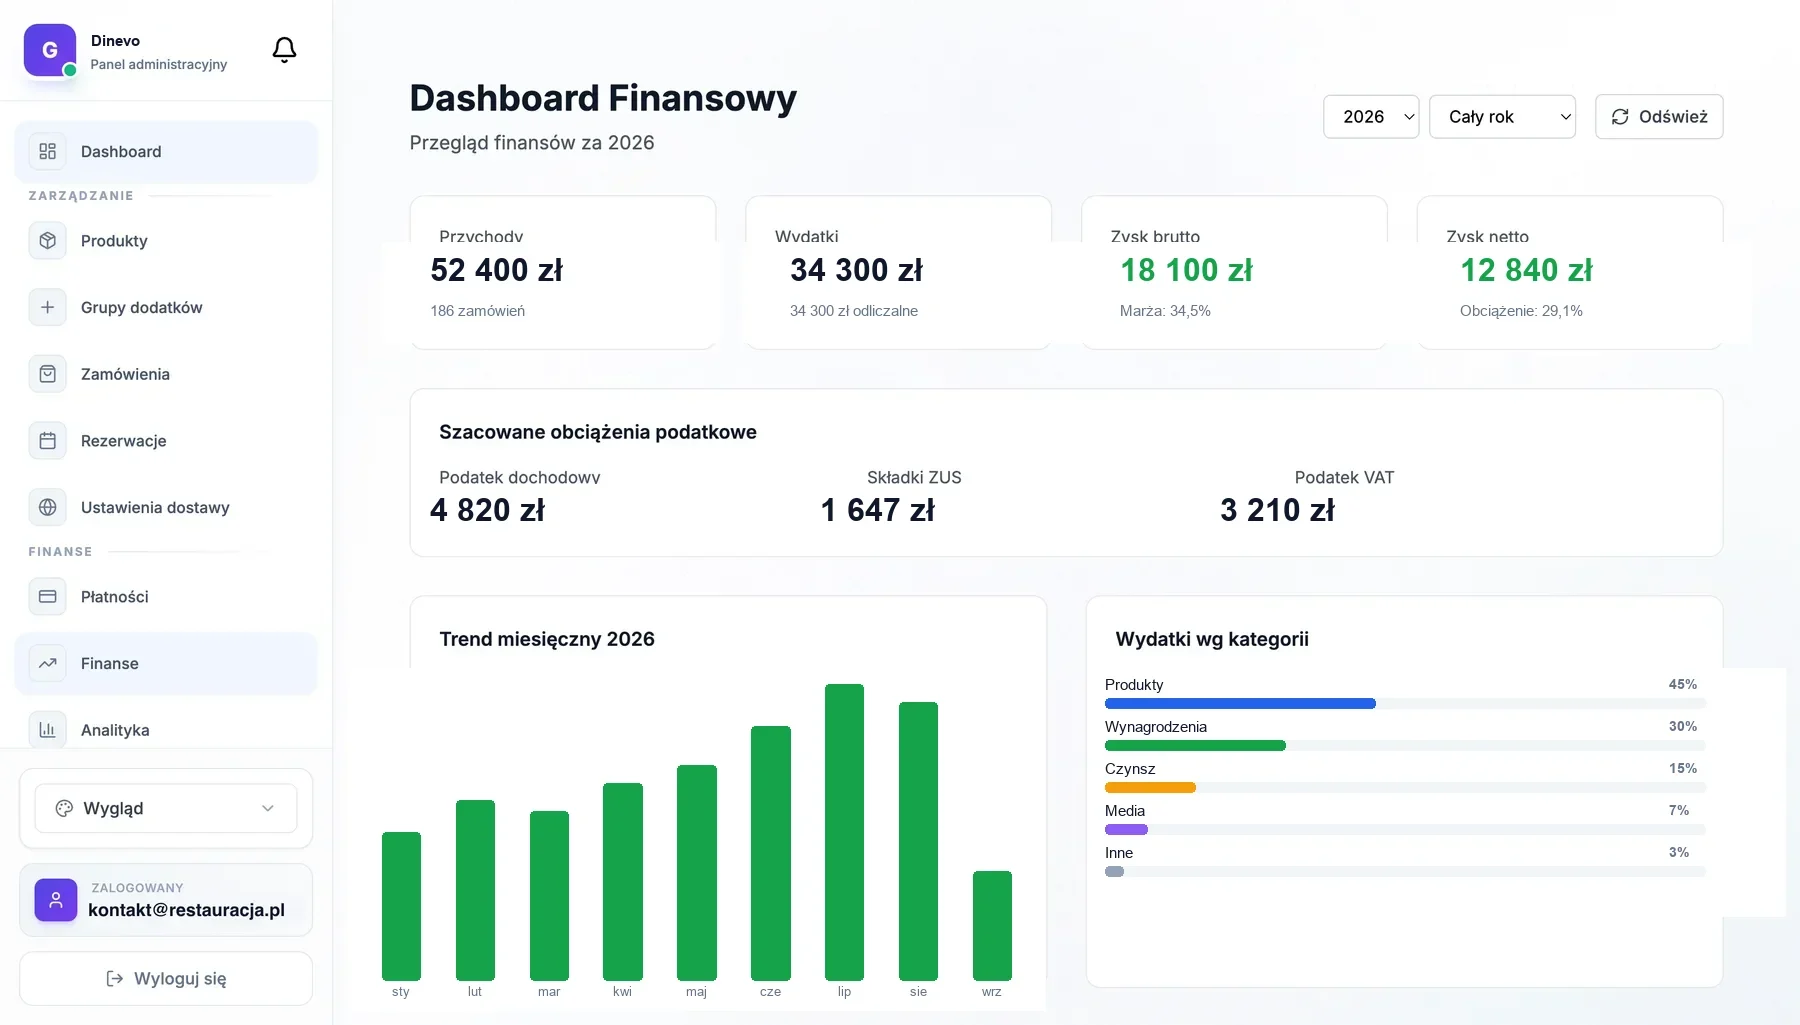
Enter costs: product deliveries, utility bills, salaries. System automatically calculates real profit — revenue minus expenses.
- Expense categories (products, utilities, salaries)
- Assign invoices to categories
- Auto-margin calculation
- Monthly cost comparison
Reports
Professional Documents
Generate PDF reports or export to Excel. Perfect for accountant, investor, or your own analysis.
Daily Report
Daily summary
Weekly Report
Full week overview
Monthly Report
Full month analysis
Product Report
Sales per menu item
Staff Report
Team performance
Cost Report
All expenses
Export Data
- Download PDF
- Excel Export
- CSV Export
Gallery
See system in action
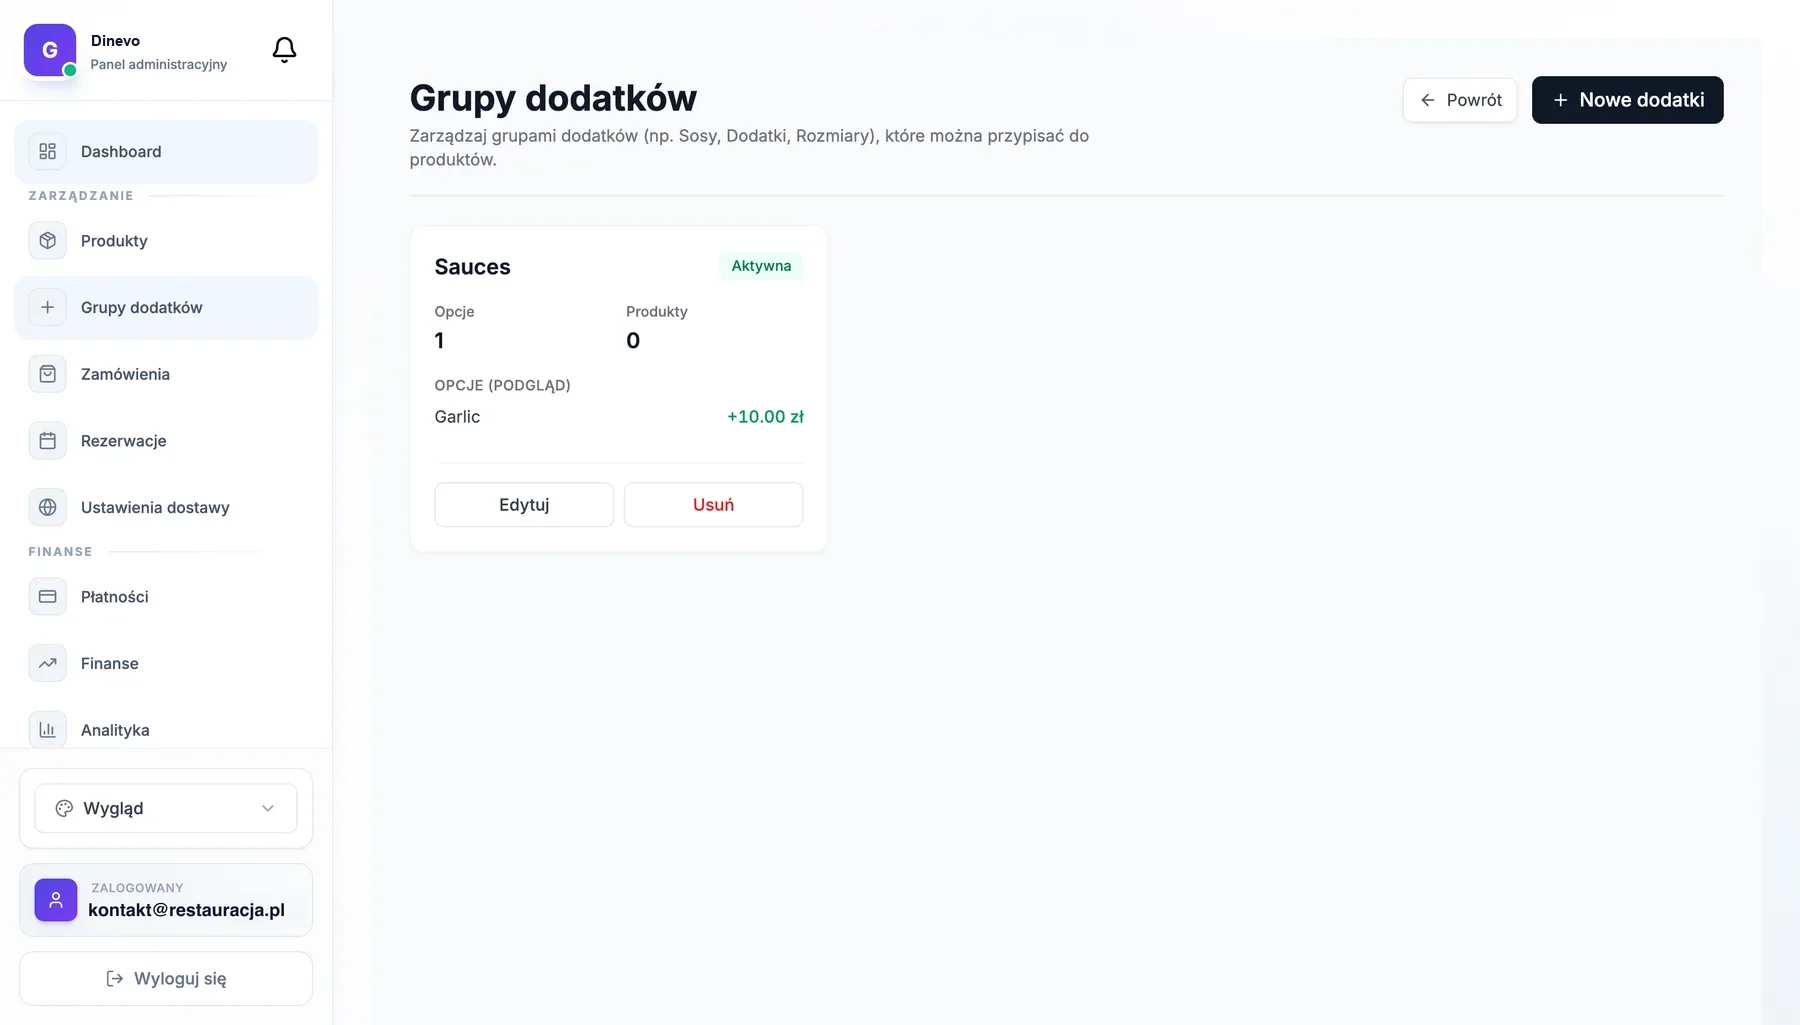
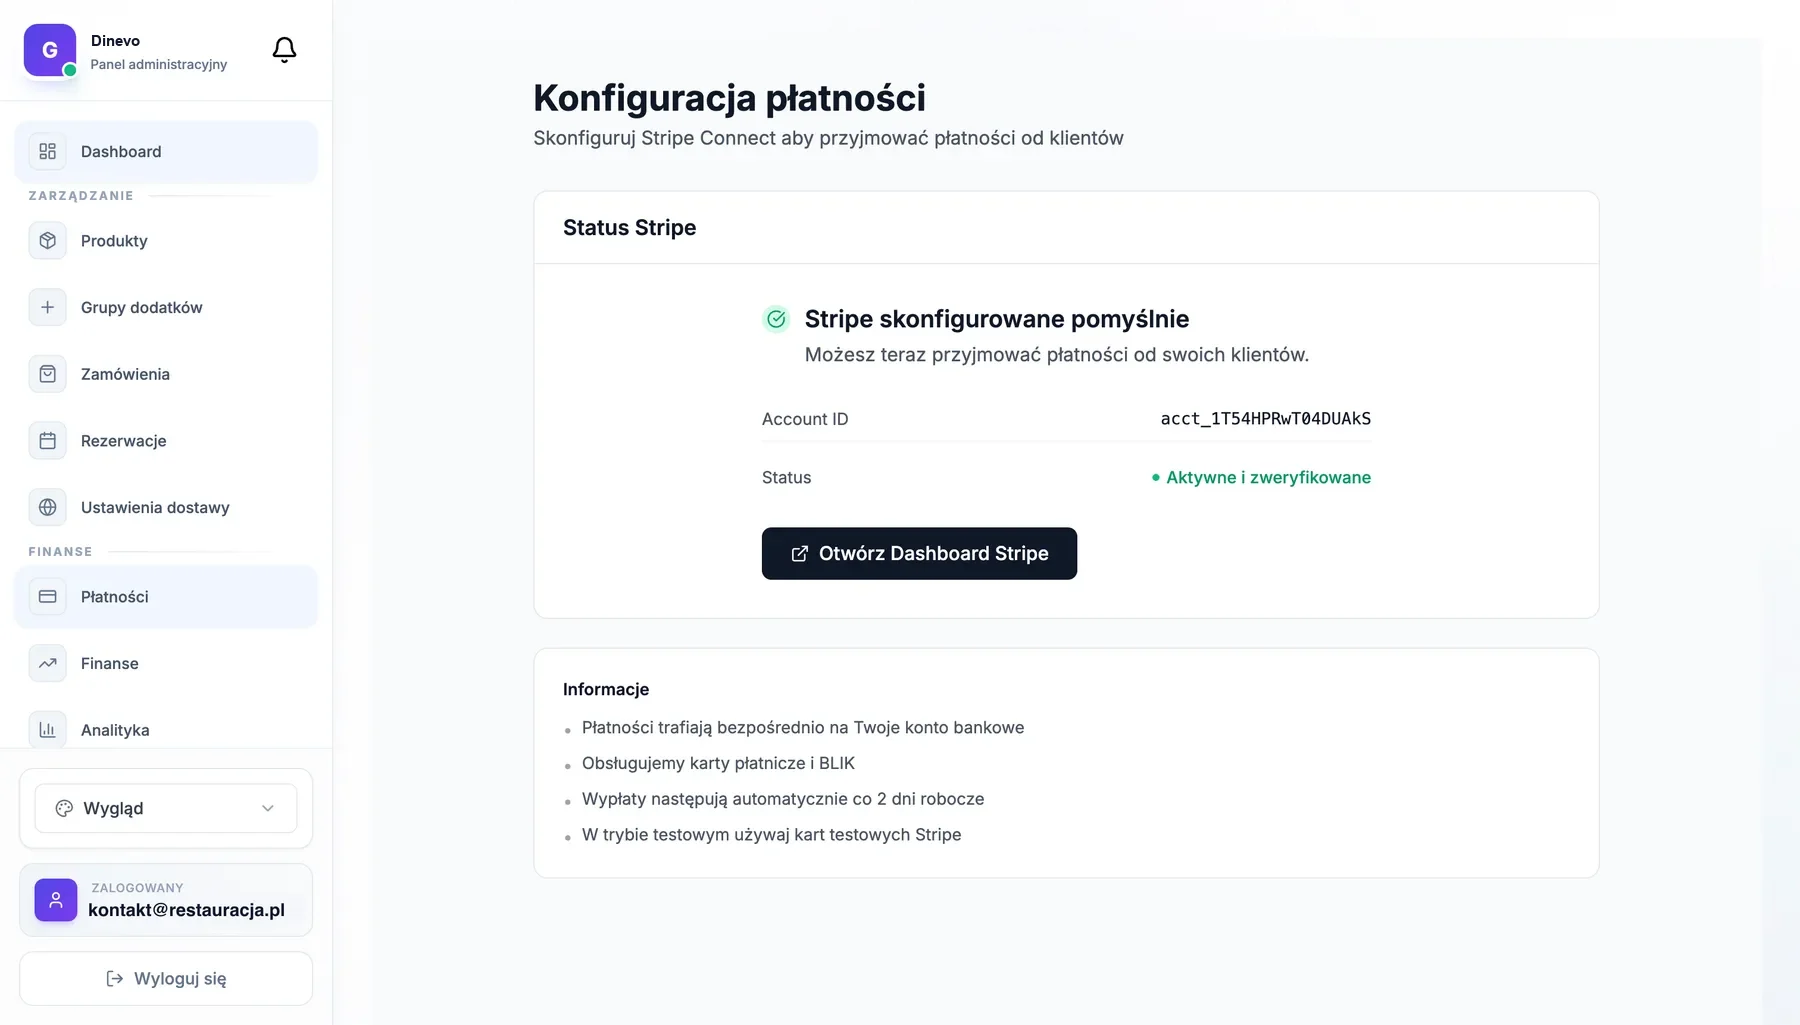
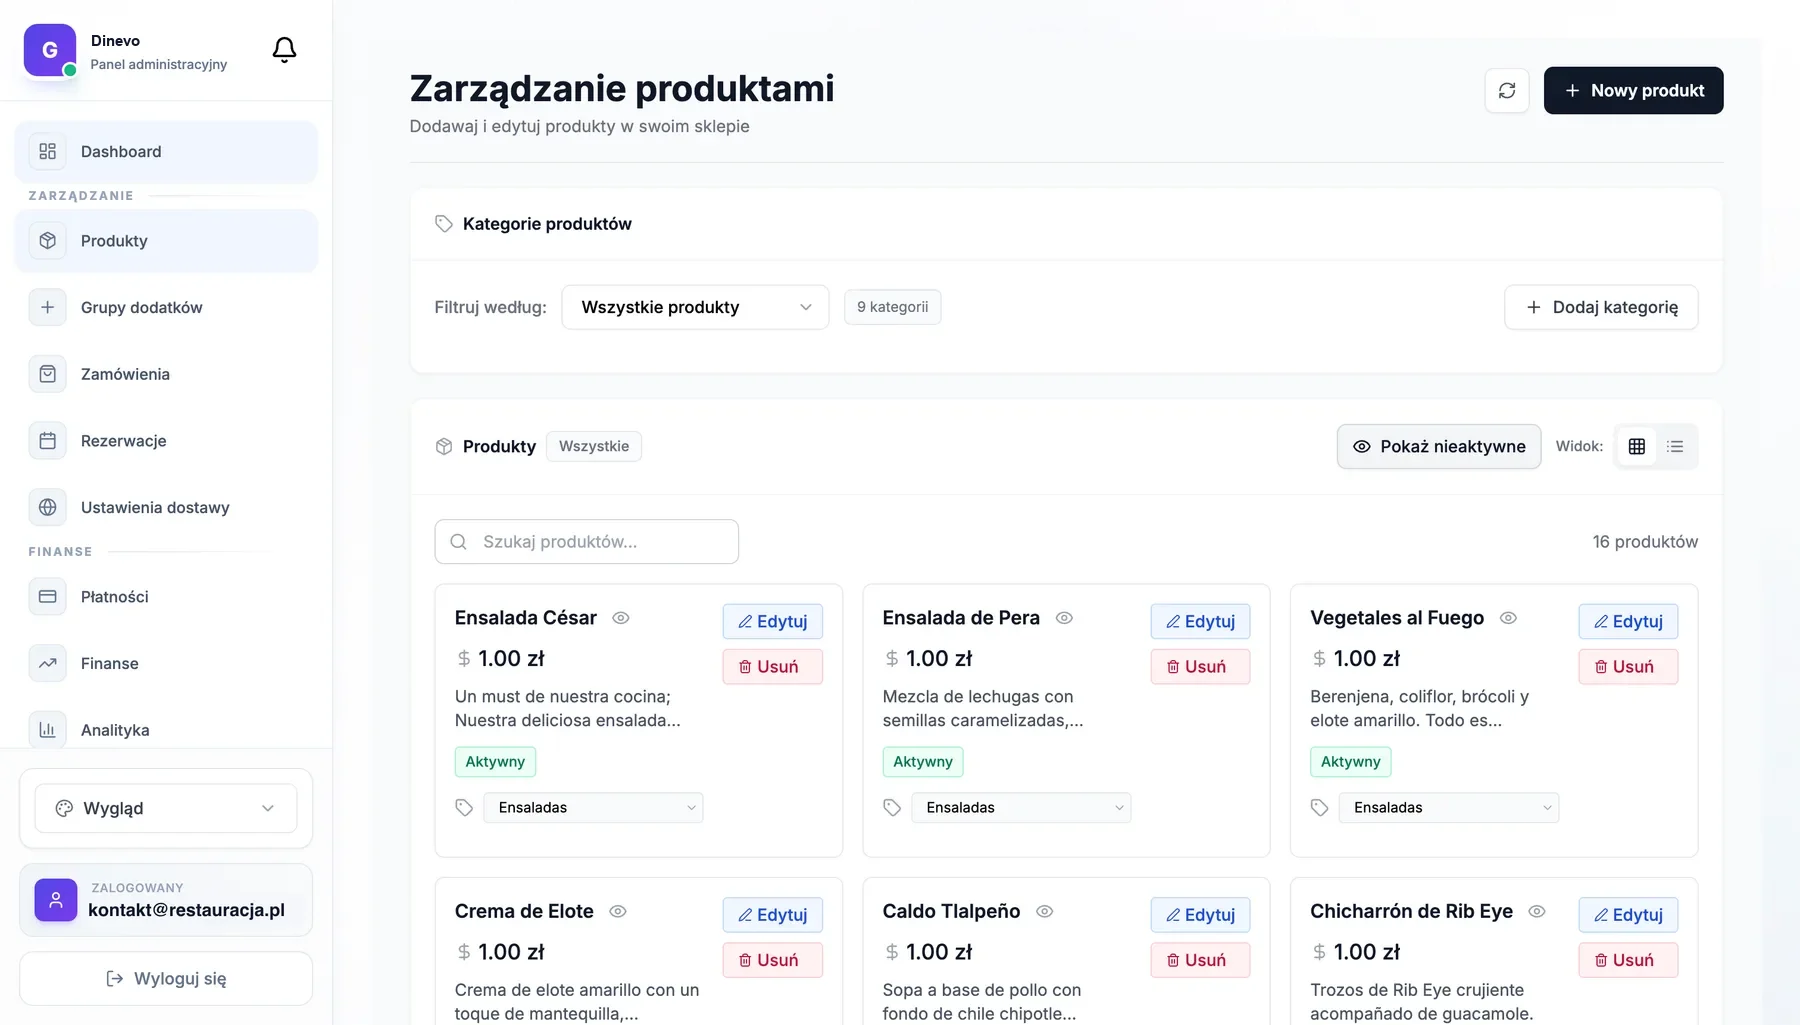
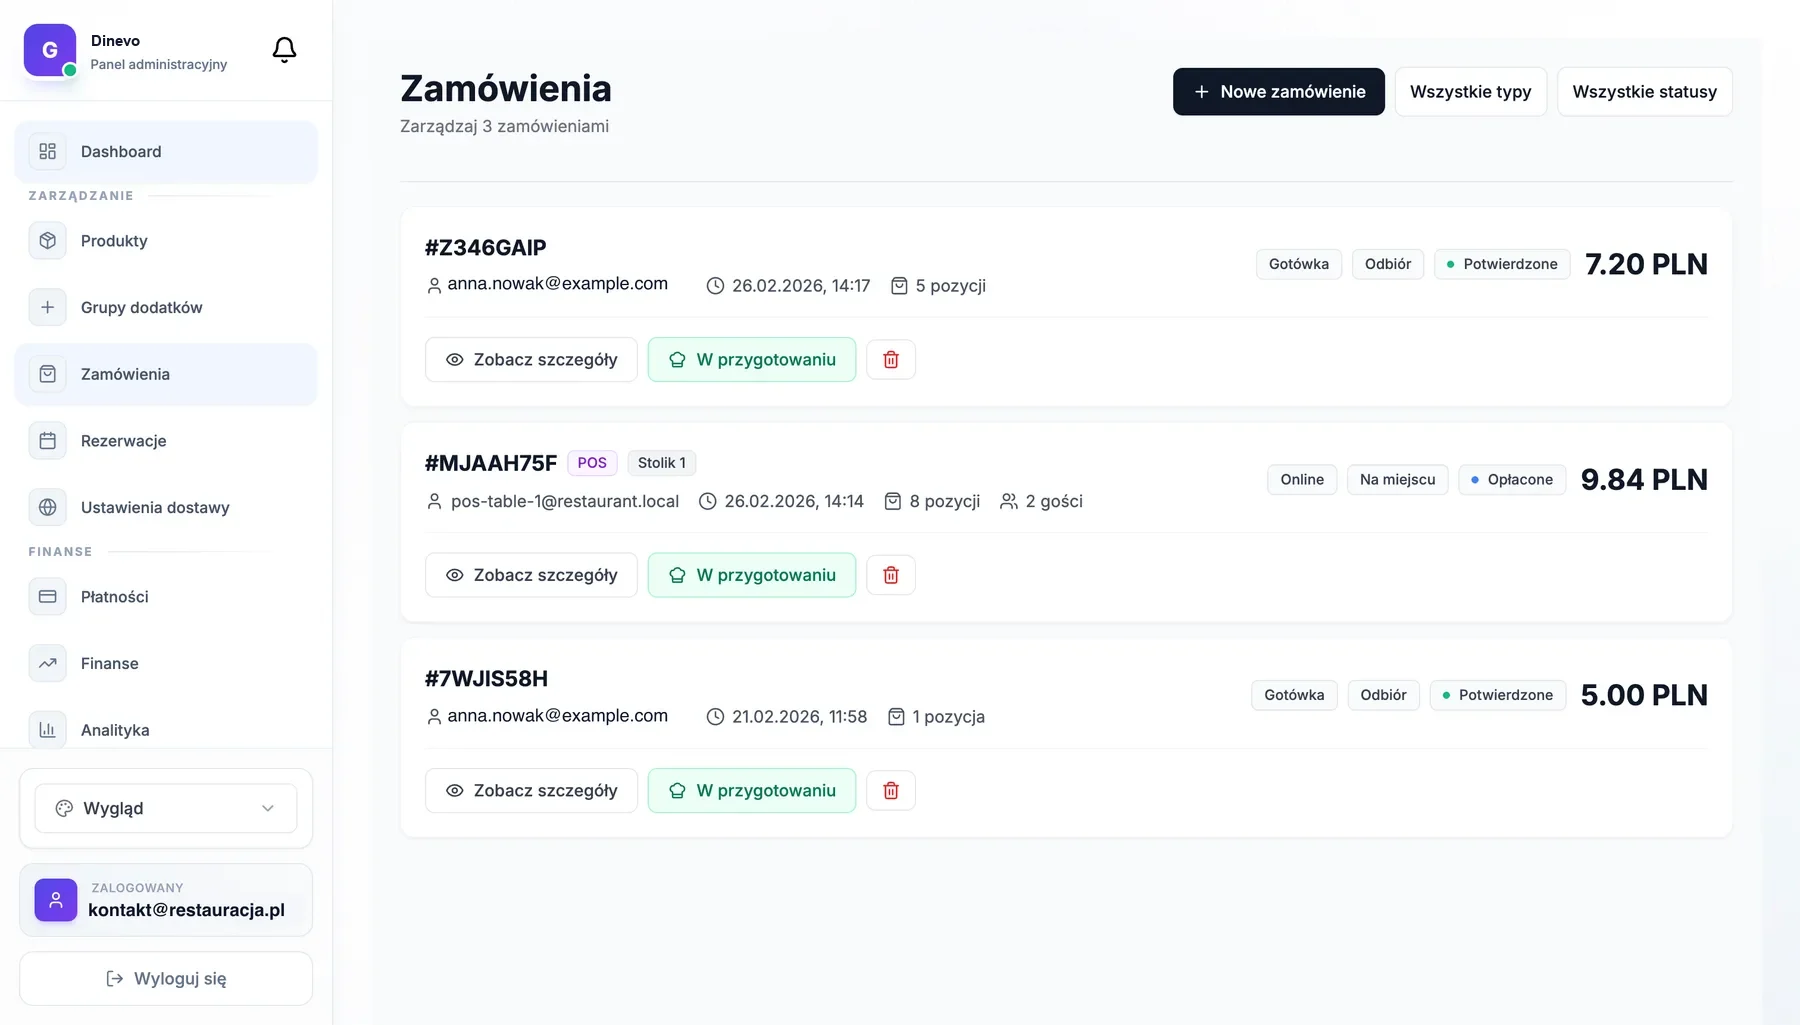
Real views from the panel — dashboard, product list and order history.
Funkcje
Full data control
Sales Charts
Daily, weekly, monthly revenue overview. See trends and sales peaks.
Expense Tracking
Enter costs: suppliers, bills, salaries. System calculates real profit automatically.
PDF Reports
Generate professional reports with one click. Ideal for accountant.
Excel Export
Download data to spreadsheet. Analyze in your tools.
Bestsellers
Which dishes sell best? Product ranking with growth trend.
Period Comparison
This month vs previous. This year vs last. See progress in numbers.
What else is in the panel
- Tax & social security
- Estimates income tax and social-security contributions based on your chosen tax scheme.
- Monthly history
- A summary of every month: revenue, costs, margin and net profit in one place.
- Daily forecast
- Projects end-of-day revenue and next-hour orders from today's sales so far.
- Peak hours
- Order distribution across the day — see when you need more hands on deck.
- Payment methods
- Cash versus online split: transaction counts and share of turnover.
- Returning customers
- New versus returning, plus a ranking of your highest-value customers.
- Coupon performance
- How often each promo code was used and how much revenue it generated.
- Waiter performance
- POS reports: turnover and number of bills handled, broken down by waiter.
FAQ
Frequently Asked Questions
Have more questions? See full FAQ or contact us

Make decisions
Stop guessing. See what really works in your restaurant and make better business decisions.